Shared shell
Keep navigation, layout and interaction behavior familiar across roles.
Helping users understand their day, decide where to start, and act without losing context.
A central challenge was that the dashboard could not be optimized for a single role. KCF had 12 personas with different responsibilities and definitions of what “important” meant. I approached the concept as a configurable framework: keep the interaction model consistent, then adapt the information hierarchy, modules and actions to each persona. The Technical Analyst screens shown here are one expression of that system.
Keep navigation, layout and interaction behavior familiar across roles.
Change what gets prominence based on the work each persona is responsible for.
Use modular content so the same framework can flex across 12 different personas.
KCF sensors monitor machine health across manufacturing environments. The dashboard concept was designed to help each user quickly understand the work, issues and activity relevant to their role so they can decide what deserves attention first.
Bring the most relevant issues, tasks, alarms and activity together so users do not have to assemble their day across multiple views.
Help users move from “what is happening?” to “where should I start?” through role-relevant information hierarchy.
Create a common dashboard framework that can adapt its content and priorities across 12 different user types.
The screens shown represent the Technical Analyst persona. The underlying architecture is designed so modules, metrics and priorities can adapt by role while preserving a consistent interaction model.
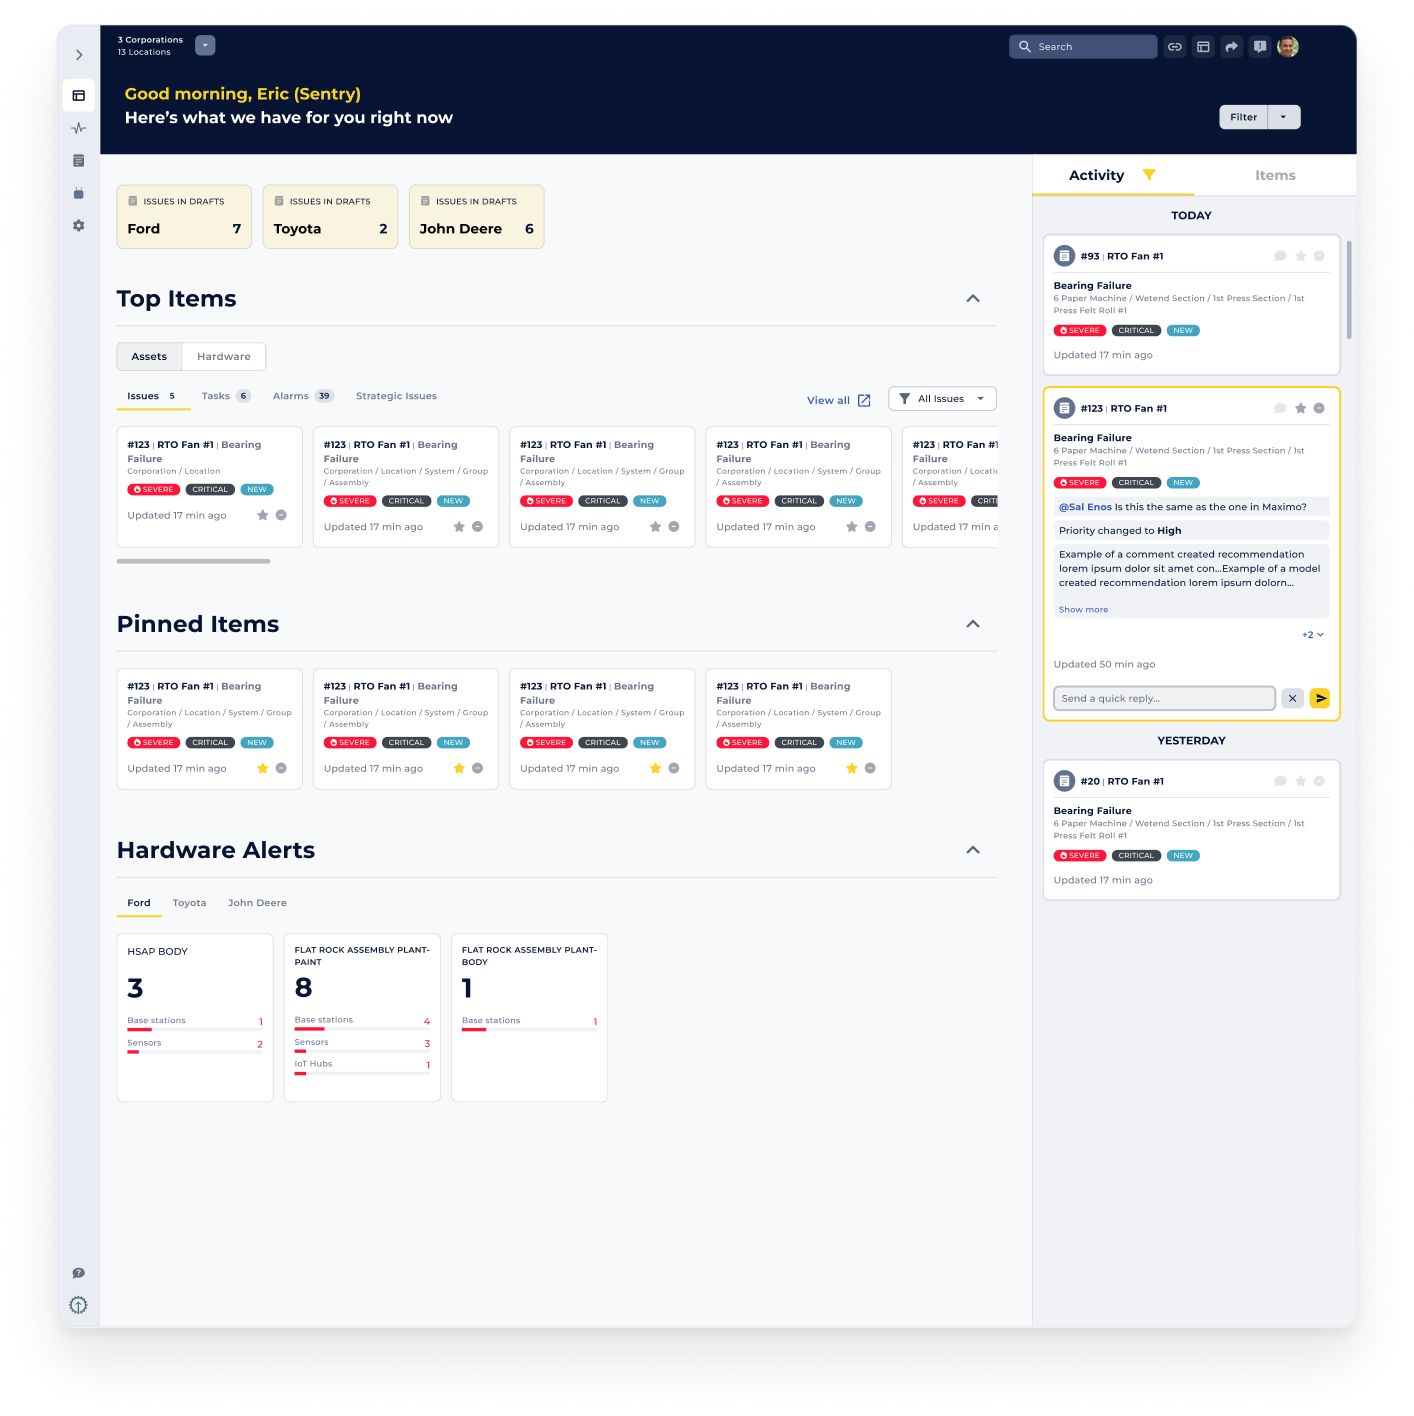
A persistent right-side activity panel transforms into an Item View when a dashboard item is selected. Users can inspect one layer deeper, view additional information and take quick actions while keeping the broader dashboard context visible.
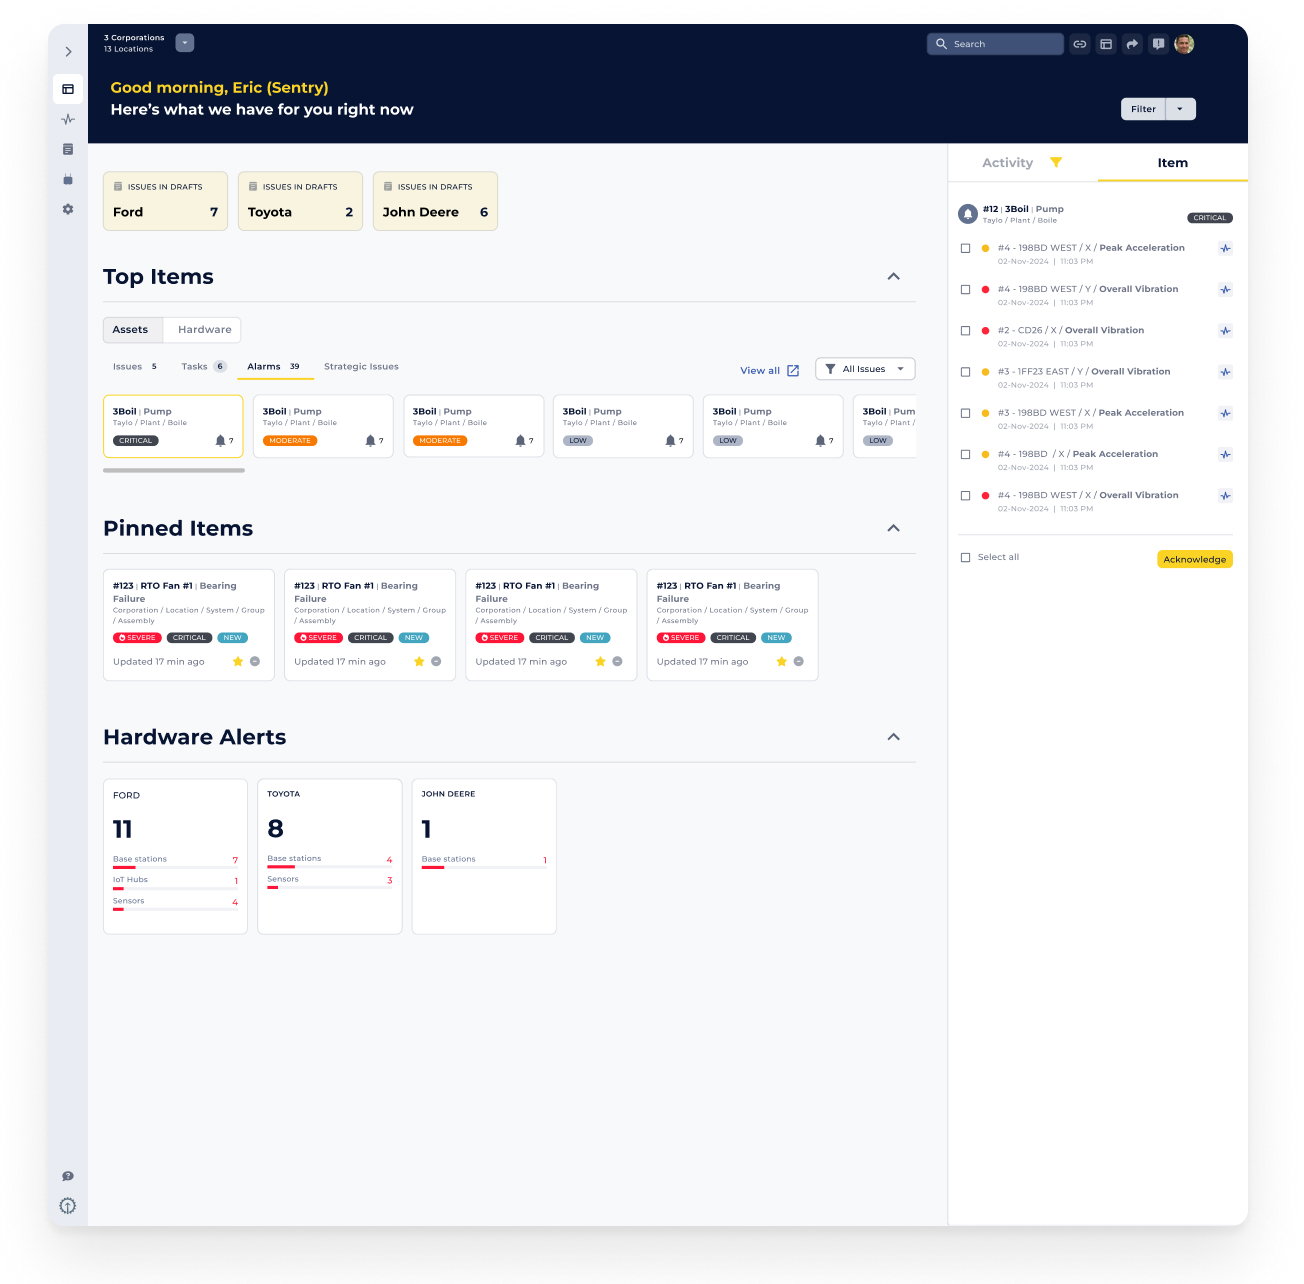
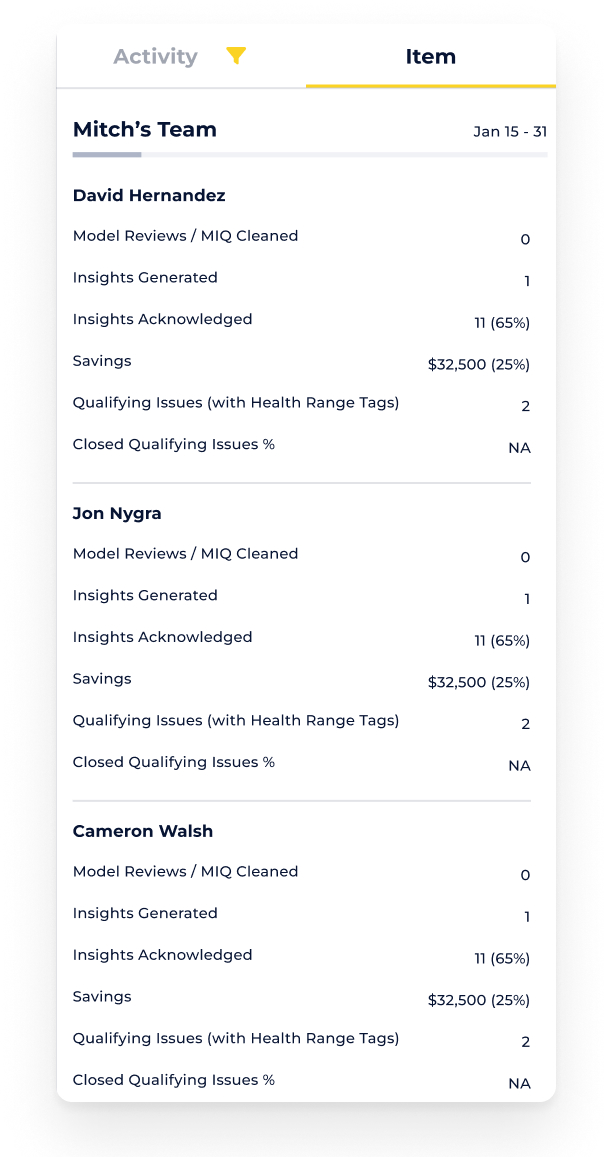
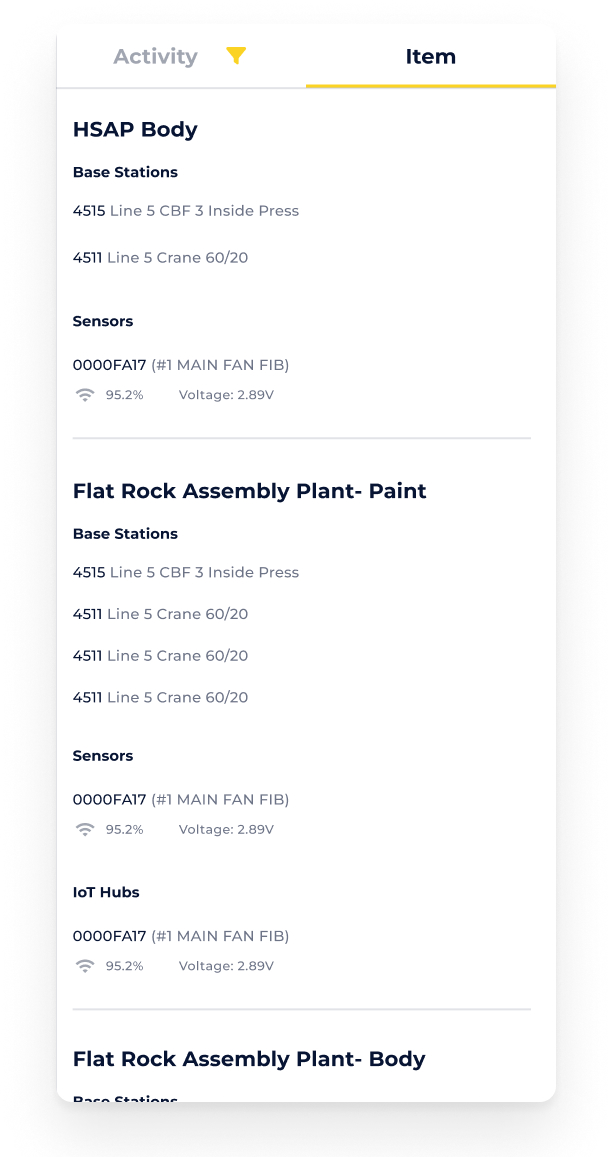
The goal was not to create 12 unrelated dashboards. The concept establishes a shared interaction framework and allows the information hierarchy, modules and actions to adapt to the needs of each persona.
Navigation • layout • interaction patterns • activity model
Relevant metrics • tasks • issues • priorities • actions
Technical Analyst dashboard shown in this case study
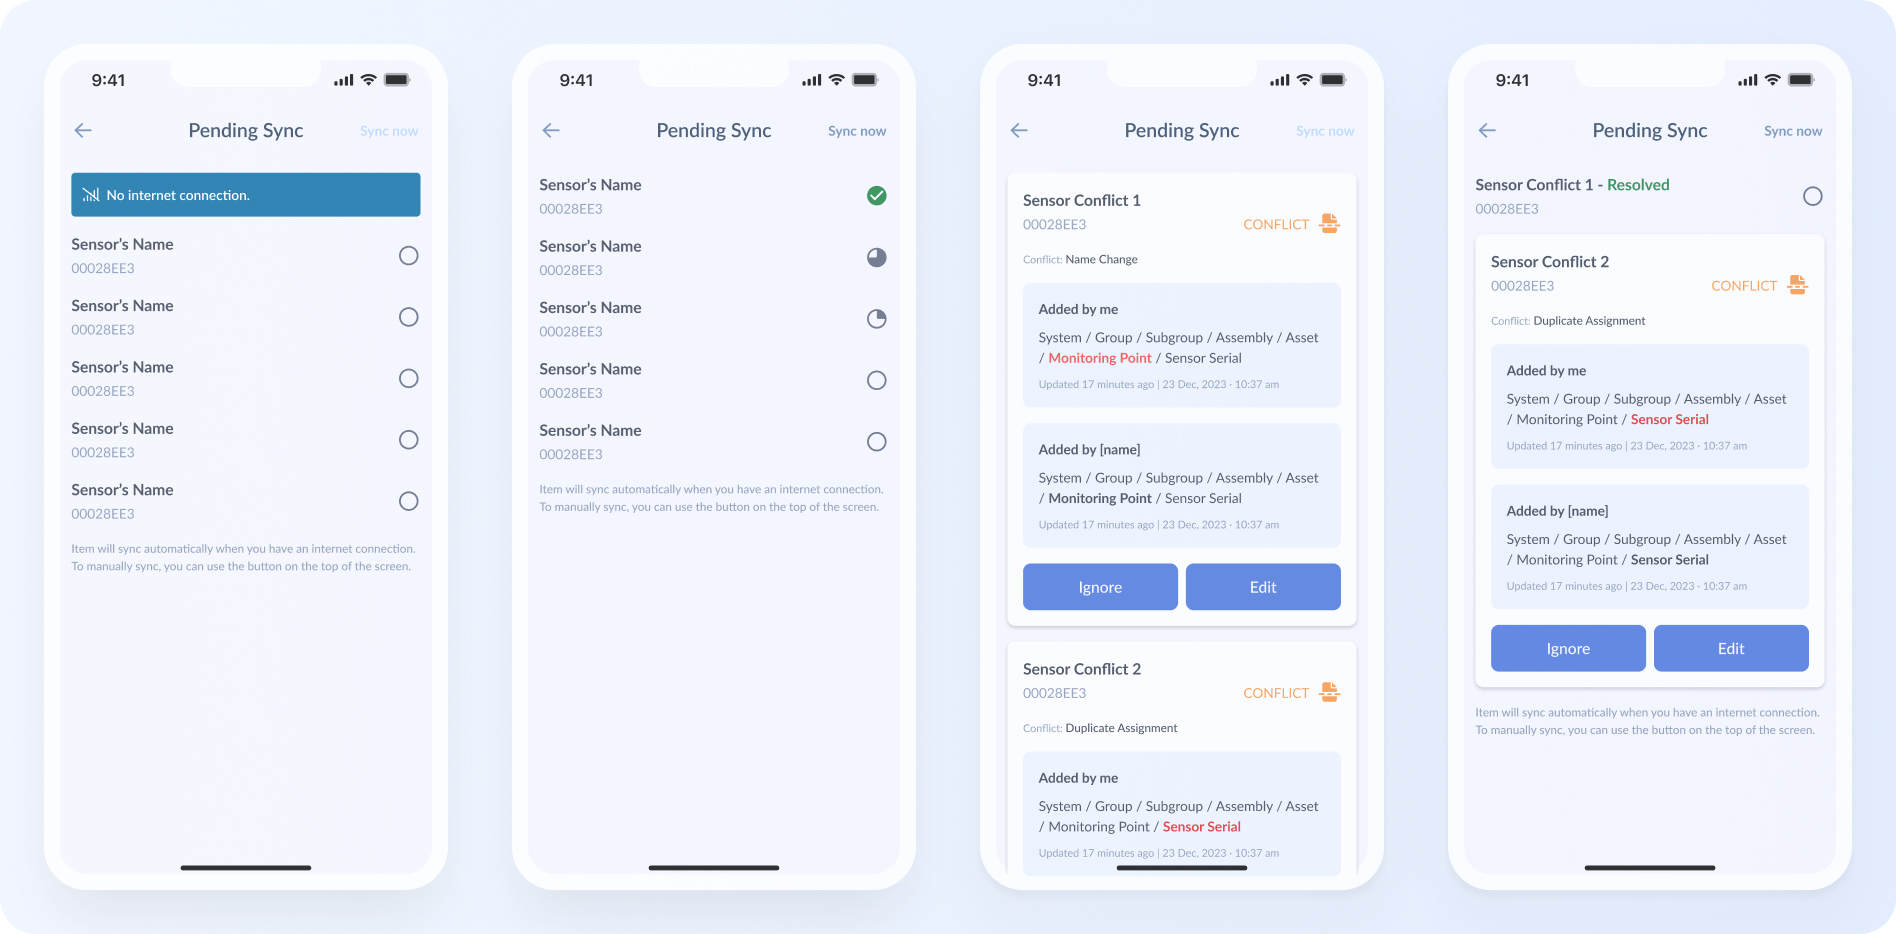
The mobile concepts address a separate operational problem: making synchronization visible and understandable. Pending sync, offline states, successful sync and conflicts give field users clearer feedback about what has been saved, what is waiting, and what requires intervention.
Across desktop and mobile, the concept focuses on helping users understand state, maintain context and move confidently from information to action.